
Notes on
Site Reliability Engineering:
How Google Runs Production Systems
I. Introduction
1 Introduction
2 Google Infrastructure
Terminology:
- a machine is a piece of hardware;
- a server is a piece of software running on a machine;
2.1 Global Structure
Tens of machines in racks; racks in rows; a set of rows make a cluster; a datacenter may contain several clusters;
Datacenter connectivity: Clos network fabric named Jupiter; up to 1.3 Pbps
Datacenters are connected using an SDN switch B4, using OpenFlow; it represents the backbone network between datacenters;
2.2 Managing hardware
Hardware control and administration on massive scale. Handling hardware failures;
Borg is a distributed cluster operating system (similar to Apache Mesos).
A cluster has:
- a BorgMaster with the persistent storage using Paxos;
- external scheduler;
- muptiple borglets;
- it's managed through external tools and config files;
Borg is responsible for running user jobs: indefinitely running servers or MapReduce jobs. Jobs consist of (maybe a thousands of) tasks being supervised and scheduled by Borg; Every job needs to specify its required resources (e.g. 3 CPU cores, 2 GiB of RAM, etc).
Borg Naming Service (BNS) allocates namespaces for tasks; e.g. resolved to
2.3 Storage
Tasks may use the local storage if needed. Cluster storage layers:
- D (disk):
- Colossus (successor to the Google File System, GFS): cluster-wide FS; replication, encryption.
- database-like services built on top of Colossus:
- Bigtable: a NoSQL database system, sparse, distributed, persistent multidimensional sorted map indexed by row key, column key, timestamp mapping to an array of bytes; eventually consistent, cross-datacenter replication.
- Spanner: an SQL-like interface;
- others, like Blobstore;
2.4 Networking
OpenFlow-based SDN. the Bandwidth Enforcer (BwE); Global Software Load Balancer (GSLB):
- geographic load balancing for DNS requests;
- load balancing at a user service level;
- load balancing at the RPC level;
2.5 Locking
Chubby: FS-like API for managing locks (even between datacenters), using Paxos consensus; the data that must be consistent.
2.6 Monitoring
Borgmon
2.7 RPC
Stubby (aka opensourced gRPC). frontend – backend; protocol buffers (protobufs).
II. Principles
3 Embracing Risk
99.9999% reliable is in practice often not distinguishable from 99.9% reliable, often prohibitively increasing cost and hindered flexibility. Cost/benefit analysis.
4 Service-level Objectives
4.1 Terminology
- SLI: Service-Level Indicators: clear quantative metrics; e.g. availability, request latency, durability, yield, etc.
- SLO: Service-Level Objectives: e.g. \(SLI \leq threshold\), \(lower \leq SLI \leq upper\);
- SLA: Service-Level Agreements: explicit or implicit contracts with users about consequences of meeting or missing the expected SLOs. may be financial (a rebate or a penalty). e.g. Google Search does not have SLAs.
4.2 SLIs in practice
Examples of SLIs:
- for user-facing systems, frontends: availability, latency, throughout;
- for storage systems: availability, durability, latency;
- for big data systems: throughput, end-to-end latency;
- for everything: correctness.
4.3 Collecting indicators
Borgmon, client-side collection.
4.4 Aggregation of measurements
Averages may be deceptive and hide bursts. Think of a measure as a distribution; work with percentiles (99.9th, 99th, etc). The mean and the median are not to be assumed close.
4.5 Standardize indicators (if possible)
e.g.
- aggregation intervals: "averaged over 1 minute";
- aggregation regions: "all the tasks in a cluster";
- frequency of measurement: "every 10 second";
- which requests are included: "HTTP GETs from black-box monitoring jobs";
- how the data are acquired: "measured at the server through our monitoring";
- data-access latency: "time to last byte";
4.6 Objectives in Practice
e.g. "99% (averaged over 1 minute) of GET RPC calls will complete in less than 100ms (measured across all the backend servers"; or "90% of GET RPC calls will complete in less than 1 ms; 99% of GET RPC calls will complete in less than 10ms; 99.9% of GET RPC calls will complete in less than 100ms";
4.7 Choosing targets
- Don't pick a target based on current performance;
- Keep it simple;
- Avoid absolutes;
- Have minimum number of SLOs enough for good coverage;
- Perfection can wait: start from a loose target and tighten it further rather than vice-versa;
4.8 Control measures
- Monitor and measure the system's SLIs;
- Compare the SLIs to the SLOs, decide if action is needed;
- If needed, figure out what needs to happen to meet the target;
- Take that action.
4.9 SLOs and expectations
- Keep a safety margin; use tighter internal SLOs;
- Don't overachieve; e.g. deliberately take the system offline, throttle some requests, design the system so it is not faster under light load, etc;
5 Eliminating Toll
If a human operator needs to touch your system during normal operation, you have a bug. The definition of normal changes as your system grows
Toll is not:
- "work I don't like to do";
- administrative work (this is overhead);
- chores (may have long-term value);
Toll is: manual, repetitive, automatable, tactical (is this work interrupt-driven and reactive?), devoid of enduring value (does the service remains in the same state after this work?), scaling linearly with the service growth.
Advertisied goal: keeping toll less than 50% of an SRE time. Do not devolve into an Ops team. Calculating toll.
5.1 What qualifies as engineering?
Engineering work is:
- novel; creative and innovative; design-driven approach to solving a problem;
- generalization;
- intrinsically requires human judgement;
- produces a permanent improvement in your service;
- guided by a strategy;
Typically falls into:
- Software engineering;
- Systems engineering;
- Toil;
- Overhead: administrative work not directly tied to running a service;
5.2 Why toll is bad
- Career stagnation;
- Low morale;
- Creates confusion;
- Slows progress;
- sets precedent;
- promotes attrition;
- breach of faith;
6 Monitoring distributed systems
Definitions.
- Monitoring: collecting, processing, aggregating, displaying real-time quantative data about a system, such as query counts and types, error counts and types, processing times, server lifetimes;
- White-box monitoring: metrics based on exposed internals of a system, including logs, interfaces like the JVM profiling interface, HTTP handlers internal stats;
- Black-box monitoring: testing externally visible behavior as seen by a user;
- Dashboard: a summary view of a service's core metrics.
- Alert: a notification intended for a human, pushed to a system such as a bug or ticket queue, an email alias, pager, etc.
- Root cause: a defect in a software or human system that, if repaired, installs confidence that this event won't happen again in the same way. An incident may have multiple root causes, each must be repaired;
- Node and machine: a single instance of a running kernel in either a physical server, virtual machine or a container. There might be several services to monitor on a given machine.
- Push: any change to a service's running software of its configuration;
6.1 Why monitor?
- analyzing long-term trends;
- comparing over time or experiment groups;
- alerting;
- building dashboards;
- ad hoc retrospective analysis, e.g. debugging;
- raw input for business analytics and analysis of security breaches;
"What is broken?" and "What's about to break?" "Something seems a bit weird" is not a reason for alering a human.
6.2 Reasonable expectations for monitoring
Rules that generate alerts for humans should be simple to understand and represent a clear failure.
A monitoring system should address "What's broken and why?" e.g.
| Symptom | Cause |
|---|---|
| "Serving HTTP 500s or 404s" | "database servers are refusing connections" |
| "my responses are slow" | "CPUs are overloaded by a bogosort or …" |
| "Antarctica is not receiving animated cat GIFs" | Your CDN hates scientists and felines |
| "Private content is publicly accessible" | A new software ACLs are broken |
etc.
6.3 White-box vs Black-Box
heavy use of white-box monitoring with modest but critical uses of black-box monitoring.
Black-box monitoring is symptom-oriented and represents active—not predicted—problems; White-box monitoring relies on innards of a system. Detection of imminent problems, failures masked by retries, and so forth.
For a multilayered system, one person's symptom is another person's cause.
6.4 The Four Golden Signals
Latency: time of serving a request. Distinguish failed and successful requests (e.g. failed requests may be very fast; on the other hand, a slow error is often worse than a fast error).
Traffic: e.g. HTTP requests per second.
Errors: the rate of requests that fail, either explicitly (e.g. HTTP 500s), implicitly (e.g. HTTP 200 coupled with the wrong content), by policy (e.g. "if you committed to one-second response time, any request over one second is an error"). Internal protocols to track partial failure modes.
Saturation: how "full" your service is. Systems degrade in performance before being 100% utilized. Often saturation is signalled by latency increase. Measuring 99th percentile response time over some small window can give a very early signal of saturation. Prediction of satuaration (e.g. "your database will fill its hard drive in 4 hours").
6.5 Worrying about your tail
Collect bucketed latencies.
Choosing an appropriate resolution for measurements: not too often.
6.6 As simple as possible, no simpler.
- rules must be simple, predictable, as reliable as possible;
- data collection, aggregation, alerting configuration that is rarely used, is a candidate for removal;
- signals that are collected, but not exposed in any prebaked dashboard not used for any alert, are up to removal;
6.7 Tying the above principles together
- Does this rule detect an otherwise undetected condition that is urgent, actionable, actively or imminently user-visible?
- Will I ever be able to ignore this alert, knowing it's benign?
- Does this alert definitely indicate that users are being negatively affected?
- Can I take action in response to this alert? Is it urgent?
- Are other people getting paged for this issue?
- Every time the pager goes off, I should be able to react with a sense of urgency. I can only react with a sense of urgency a few times a day before I become fatigued.
- Every page should be actionable;
- Every page response should require intelligence.
- Pages should be about a novel problem or an event that hasn't been seen before.
6.8 Monitoring for the long term
7 Evolution of Automation at Google
Automation is a force multiplier, not a panacea. Judicious application.
7.1 Value of Automation
Consistency. Reproducibility. Automation creates a platform (systemic effect). Centralization of mistakes. Faster repair. Reduced Mean Time to Repair (MTTR). Faster action. Machines are faster. Time saving.
In favor of automation at Google: global scale, quite uniform production environment, advanced automatic system management.
7.2 The use cases for automation
- user account creation;
- cluster turnup and turndown for services;
- software and hardware installation and decomissioning;
- rollout of new software versions;
- runtime configuration changes; changing your dependencies;
- etc.
7.3 A Hierarchy of Automation Classes
The evolution of automation:
- No automation
- Externally maintained system-specifc automation;
- Externally maintained generic automation;
- Internally maintained system-specific automation;
- Systems that don't need any automation;
7.4 SRE Nirvana: Automate Yourself out of the Job!
7.5 Automation: Enabling Failure at Scale
8 Release Engineering
Expert knowledge of
- build systems and tools, compilers, environments, package managers, installers, etc.
- multiple domains: development, configuration management, test integration, system administration, customer support, etc;
Consistent and reproducible methodologies.
8.1 The Role of Release Engineers
8.2 Self-Service Model
Teams must be self-sufficient to scale. Truly automatic releases.
8.3 High Velocity
Some teams adopt "Push On Green" methodology.
8.4 Hermetic Builds
Builds tools must allows us to ensure consistency and repeatability. Hermetic: insensitive to the libraries and tools installed on a machine. Every build of the same revision should produce the identical result. cherry picking to push fixes into production.
8.5 Enforcement of Policies and Procedures
Gated operations:
- approving source code changes;
- specifying the actions to be performed during the release process;
- creating a new release;
- approving the initial integration proposal and subsequent cherry picks;
- deploying a new release;
- making changes to a project's build configuration;
Almost all changes require a code review. An automated report on all changes, archived among the build artefacts.
8.6 Continuous Build and Deployment
An automated release system called Rapid.
8.7 Software Lifecycle at Google
- Building: Blaze is the build tool of choice: C++, Python, Java, Go, JavaScript.
- Branching: All code is checked into the main branch of the source code tree, mainline. Branching from a specific revision and never merge changes from the branch back into the mainline.
- Testing: A continuous test system.
- Packaging: the Midas Package Manager (MPM) assembles packages based on Blaze rules listing the artefats to include. Packages are named (e.g.
search/shakespeare/frontend), versioned with a unique hash and signed to ensure authenticity. Labels may be applied, like "dev", "canary", "production".
8.8 Rapid
is configured with files called blueprints. Rapid client may request performing some operations on a Rapid service, according to ACLs.
A typical release process with Rapid:
- creating a release branch from the requested integration revision number;
- Blaze builds all the artifacts and executes the unit tests; parallelization;
- build artifacts are then available for system testing and canary deployments;
- the results of each step of the process are logged. A report of all changes since the last release is created;
8.9 Deployment
Rapid is often to used to drive simple deployments directly: it updates Borg jobs to use newly built MPM packages. For more complicated deployments: use Sisyphus.
For sensitive pieces of infrastructure, release rollouts may take days.
8.10 Configuration Management
requires close collaboration of SREs and release engineers. Binary releases and configuration changes are decoupled. Possible options:
- bundle configuration in the binary package;
- "configuration packages";
- read configuration files from an external source.
8.11 It's not just for Googlers
8.12 Start Release Engineering at the Beginning
9 Simplicity
Keep agility and stability in balance in the system.
9.1 System Stability versus Agility
Sometimes it makes sense to sacrifice stability for agility. Exploratory coding. We want a balanced mix of stability and agility.
9.2 The Virtue of Boring
Essential complexity vs accidental complexity.
9.3 I Won't Give Up My Code!
Emotional attachement to code. Unnecessary code must be purged, not commented out or flag-gated. Use SCM to keep old code. Remove dead code, build bloat detection into all stages of testing. Every new line of code may be a liability in some cases.
9.4 "The Negative Lines of Code" Metrics
9.5 Minimal APIs
Perfection is finally attained not when there is no longer more to add, but when there is no longer anything to take away,
Il semble que la perfection soit atteinte non quand il n'y a pas rien à ajouter, mais quand il n'y a plus rien à retrancher – Exupery.
9.6 Modularity
Loose coupling between binaries or between binaries and configuration promotes both developer agility and system stability. Versioning API. No "misc" or "util" classes/binaries. A well-designed distributed system consists of collaborators, each of which has a clear and well-scoped purpose. This applies to data formats too: protobufs.
9.7 Release Simplicity
Smaller batches of changes for release.
9.8 Simple Conclusion
Software simplicity is a prerequisite to reliability.
III. Practice
SREs run services—a set of related systems, operated for users, who may be internal or external—and are ultimately responsible for the health of these services. It involves:
- developing monitoring systems;
- planning capacity;
- responding to incidents;
- ensuring the root causes of outages are addressed.
Maslow-like pyramid of reqirements for the health of a service:
		   = Product =
		== Development ==
	    === Capacity Planning ===
	 = Testing + Release Procedures =
      == Postmortem / Root Cause Analysis ==
   ============ Incident Response =============
================== Monitoring =====================
- Monitoring: You want to be aware of problems before your users notice them.
- Incident Response: remain in touch with how distributed computing systems work. Figuring what's wrong is the first step.
- Postmortem and Root-Cause Analysis: a blameless postmortem culture.
- Testing: prevent the encountered problems in the future.
- Capacity Planning: Load balancing, addressing cascading failures.
- Development:
- Product:
Further reading: company-wide resiliency testing.
10 Practical Alering from Time-Series Data
May the queries flow and the pager stay silent – Traditional SRE blessing.
Monitoring enables service owners to make rational decisions, apply scientific method to incident response and of course ensure their reason of existence: measure service alignment with business goals. Monitoring a very large system is challenging:
- the sheer number of components;
- maintain reasonably low maintenance burden on the engineers;
At scale, being alerted for a single-machine failure is unacceptable. Build systems robust against failures in the systems they depend on. A large system should be designed to aggregate signals and prune outliers. Alert for high-level service objectives, but retain the granularity to inspect individual components as needed.
10.1 The Rise of Borgmon
Similar to Borgmon open-source projects: Riemann, Heka, Bosum, Prometheus.
Borgmon: common data exposition format. Used for rendering charts and creating alerts.
Metrics format is standardized to facilitate mass collection. An older standard is varz, e.g.
$ curl http://webserver.google.com/varz
http_requests 37
errors_total 12
A Borgmon can aggregate information from other Borgmons. Typically, a team runs a single Borgmon per cluster and a couple of Borgmons globally.
10.2 Instrumentation of Applications
/varz HTTP handler exports variables in text. A later extension added mapped variables, e.g.:
http_responses map:code 200:25 404:0 500:12
The free-form format requires careful change management.
10.3 Collection of Exported Data
A Borgmon instance is configured with a list of targets using one of many name resoltion methods. The target list of often dynamic.
At predefined intervals (spread in time for different nodes), /varz is fetched, the results are parsed and stored. "Synthetic" variables for each targets are recorded:
- if the name was resolved to host:port,
- if the target responded to a connection,
- if the target responded to a health check,
- what time the collection has finished.
10.4 Storage in the Time-Series Arena
A service is typically made up of many binaries running as many tasks, on many machines in many clusters.
Borgmon data are stored in an in-memory database, checkpointed to disk in the form in chronological lists, time-series, and each time-series is named by a unique set of labels, of the form . E.g. a time-series "http_requests" may hold a feed of these values for a bunch of different hosts. A memory block with such a table is called the time-series arena, with a GC that purges the oldest entries when the block is full. Time difference between now and the oldest entry is the horizon (typically 12 hours).
Periodically, the in-memory state is archived to an external system, Time-Series DataBase, TSDB.
10.5 Labels and Vectors
The name of a vector is a set of key-value labels. Important keys are:
- var;
- job;
- service;
- zone;
Together, e.g.
{var=http_requests,job=webserver,instance=host0:80,service=web,zone=us-west}
10.6 Rule Evaluation
Borgmon is really just a programmable calculator with some syntactic sugar that enables it to generate alerts. Rules are simple algebraic expressions that compute time-series from other time-series. Rules run in a parallel threadpool when possible, but have a topological order. Internal metrics of the runtime of the rueles are exported for performance debugging and for monitoring the monitoring.
Aggregation and counters, gauges.
E.g.
rules <<<
  # compute the rate of requests
  {var=task:http_requests:rate10m, job=webserver} =
    rate({var=http_requests,job=webserver}[10m]);
  # sum the rates
  {var=dc:http_requests:rate10m,job=webserver} =
    sum without instance ({var=task:http_requests:rate10m,job=webserver})
>>>
Borg rules create new time-series.
10.7 Alerting
Alerts are predicates on data. Avoiding "flapping" of the boolean results: there may be a minimum interval for some predicate value to create an alert. E.g.
rules <<<
  {var=dc:http_errors:ratio_rate10m:job=webserver} > 0.01
    and by job, error
  {var=dc:http_errors:rate10m,job=webserver} > 1
    for 2m
    => ErrorRatioTooHigh
      details "webserver error ratio at [[trigger_value]]"
      labels {severity=page}
>>>
When an alert is fired, it is send by the Alert RPC to the Alertmanager, which routes the alert to the correct destination. It can be configured to:
- inhibit certain alerts when others are active;
- deduplicate alerts from multiple Borgmons that have the same labels;
- fan-in or fan-out alerts based on their labelsets when multiple alerts with similar labelsets fire;
10.8 Sharding the Monitoring Topology
A streaming protocol is used to transmit time-series data between Borgmons.
10.9 Black-Box Monitoring
Borgmon is a white-box monitoring service.
The black-box monitoring is covered with Prober, which runs a protocol check against a target and reports success or failure. It can send alerts directly to the Alertmanager. It can export its data as time-series.
10.10 Maintaining the Configuration
Separation of the definition of the rules from the monitored targets. Language templates in Borgmon.
11 Being On-Call
11.1 Introduction
11.2 Life on an On-Call Engineer
11.3 Balanced On-Call
11.4 Balance in Quantity
11.5 Balance in Quality
11.6 Compensation
11.7 Feeling Safe
Two ways of thinking being faced with challenges:
- Intuitive, automatic, rapid action;
- Rational, focused, deliberate cognitive functions;
The second one is preferred for dealing with outages in complex systems. Reduce the stress related to being on-call. Heuristics and decisions based on confirmation bias may be very tempting under stress. Intuition and quick reaction may seem desirable traits in incident management, they have downsides. Habitual responses may be disastrous. The ideal methodology in incident management strikes the perfect balance of taking steps at the desired pace when enough data is available to make a reasonable decision while simultaneously critically examining your assumptions.
- Clear escalation paths;
- well-defined incident-management procedures;
- a blameless postmortem culture;
In complicated cases, it may be useful to adopt a formal incident-management protocol. It is supported by an internal web-interface tool that automates some of actions and reporting.
It's important to evaluate what went wrong, recognize what went well and take action to prevent this event in the future. Focus on events, not on people.
11.8 Avoiding Inappropriate Operational Load
At most 50% of SRE time may be spent on operational work. What if more is needed? Loaning an experienced SRE to an overloaded team. Misconfigured monitoring. Regulate alert fan-out; deduplicate and group related alerts. Work together with the system developers on this. Exteme cases: "giving back the pager" to a developer group until SRE standards are met.
11.9 A Treacherous Enemy: Operational Underload
Consequences: overconfidence/underconfidence. Right balance of team size. "Wheel of Misfortune" exercises. DiRT: Disaster Recovery Training, a company-wide annual event.
11.10 Conclusions
12 Effective Troubleshooting
Expertise is gained by investigating why a system does not work – Brian Redman
Ways in which things go right are special cases of the ways in which things go wrong – John Allspaw
Explaining how to troubleshoot is hard, like explaining riding a bike; but it may be learnable and teachable. Troubleshooting depends on both:
- an understanding of generical troubleshooting;
- solid knowledge of the system;
Purely generic approach may work, but it's less effective.
12.1 [Generic] Theory [of troubleshooting]
An application of the hypothetico-deductive method: given a set of observations about a system and a theoretical bases for understanding system behavior, iteratively hypothesize potential causes for the failure and try to test those hypotheses.
- Problem Report.
- Triage.
- Examine.
- Diagnose.
- Test/Treat. If fails, return to Examine; if situation changes, consider re- Triage.
- Cure.
Common pitfalls
- looking at symptoms that aren't relevant or misunderstanding the meaning of system metrics.
- misunderstanding how to change the system, inputs and environments in order to safely and effectively test hypotheses;
- comin with wildly improbable hypotheses;
- spurrious correlations that are coincidences;
Correlation is not causation
12.2 In Practice
12.3 Problem Report
An effective report: the expected behavior, the actual behavior, how to reproduce the behavior (if possible). Open a bug for every issue.
Example: alert "Shakespear-BlackboxProbe_SearchFailure".
12.4 Triage
Assessing an issue severity (an exercise of good engineering judgement and a degree of calm under pressure). Ignore the instinct to start troubleshooting and search for the root cause as quickly as possible. Instead: make the system work as well as it can under the cuircumstances. Emergency options: diverting traffic to another datacenter, dropping traffic entirely to prevent cascading failire, disabling subsystems to lighten the load. "Stopping the bleeding" is the first priority. E.g. in case of creeping data corruption it is better to freeze the system than researching the root cause. (?Quick assessment of symptoms and direct consequences and preliminary action?)
12.5 Examine
We need to be able to examine each component in the system. A monitoring system records metrics: these metrics are a good place to start figuring out what's wrong. Graphing time-series and operations on time-series.
Logging. Whole stack logs via Dapper.
- text logs are useful for interactive debugging; detailed binary logs are helpful for full retrospective analysis.
- dynamic regulation of verbosity;
- statistical sampling;
- query/selection language for logs;
Exposing current state; endpoints that show reccent RPC request samples;
E.g. debugging the Shakespeare service: Black-box probing is:
- send JSON } once a minute;
- receive a JSON response:
[{
  "work": "A Midsummer Night's Dream",
  "act": 5,
  "scene": 1,
  "line": 2526,
  "speaker": "Theseus"
}]
Over the past 10 minutes about half the probes have succeeded, with no discernible pattern;
Using curl: get HTTP 502 (Bad Gateway) and no payload. Examine X-Request-Trace header with the list of backend servers;
12.6 Diagnoze
- simplify and reduce: if there are (ideally) clear boundaries between services, dissect the system into components; injecting known test data into the flow. Having a simple reproducible testcase is valuable for debugging (especially in a non-production environment). Divide and conquer: linear search from the end of the stack or bisection in huge systems;
- what, where and why: a malfunctioning system is often still trying to do something. Find out what it's doing, then ask why it's doing that and where its resources are being ysed or where the output is going.
E.g.
- Symptom: "a Spanner cluster has high latency and RPCs to its servers are timing out".
- Why? "the Spanner server tasks are using all their CPU time without any progress on all requests;
- Where in the server is the CPU time being used? Profiling the server shows it's sorting entries in logs checkpointed to disk
- Where in the log-sorting code is it being used? When evaluating a regular expression against paths to log files;
- Solutions: rewrite the regalar expression to avoid backtracking. Look in the codebase for similar patterns. Consider using RE2, which does not backtrack;
- what touched it last; systems have inertia. What updates/changes in configuration have been made recently. Correlation with those events (e.g. error rates graphed against the last deployment start and end time).
12.7 Test and Treat
Once you've come up with a short list of possible causes, it's time to find which factor is at the root of the actual problem. Following the code step-by-step, recreating dataflow. Design test so that:
- it has mutually exclusive alternatives; this may be difficult in practice;
- consider the obvious first: perform the tests in the decreasing order of magnitude; test premises for other tests first;
- an experiment may provide misleading results (e.g. a firewall may block ping requests).
- active tests may have side effects that change future results; e.g. verbose logging may slow down the system;
- some tests may be not definitive, only suggestive.
Take clear notes of what ideas you had, which tests you ran and the results seen. Take clear notes of active tests to be able to return the system to the previous state.
12.8 Negative Results are Magic
A "negative" result is an experimental outcome in which the expected effect is absent. Negative results should not be ignored or discounted. Experiments with negative results are conclusive. They tell us something certain. They can help us plan further experiments and to produce hypotheses. Documented negative results may be valuable for others.
Microbenchmarks, documented antipatterns, project postmortems. Tools and methods can outlive the experiment and guide future work. Publishing negative results improves data-driven culture. Encourage others to do the same by publishing your results.
Avoid temptation to silence negative results. Be sceptical of any design document, performance review or essay that does not mention failure (?or border conditions?) Publish the results you find surprising.
12.9 Cure
Prove the root cause hypothesis. Definitely proving may be difficult in complex production systems; often, we can only find probable causal factors, due to:
- systems are complex. There may be multiple factors to the cause. System may be path-dependent, i.e. they must be in a specific state for a failure.
- reproducing the problem in a live environment may not be an option, because, e.g. Downtime may be unacceptable or system is too complex;
Write up notes on what went wrong with the system.
12.10 Conclusion
Systematic approach to troubleshooting.
13 Emergency Response
Things break; that's the life. Long-term health of an organization depends on how the people involved respond to an emergency. Proper responses take preparation and periodic, pertinent, hand-on training.
13.1 What To Do When Systems Break
Don't panic!. The sky is not falling, at the very worst, half of the Internet is down. Pull in more people if overwhelmed. Follow an incident response protocol.
13.2 Test-Induced Emergency
Proactive approach to disaster and emergency testing.
E.g.: a test to flush out hidden dependencies on a test database within one of larget distributed MySQL databases at Google.
- Response: numerous dependent services reported that both external and internal users were unable to access the system; SRE immediately aborted the exercise. Rollback of the permissions change was unsuccessful.
- Findings about what went well: dependent services were affected. Full restoration of permissions; different approach to database access;
- What was learned: an insufficient inderstanding of this particular interaction among the dependent systems; Failed to follow the incident response protocol; rollback procedures were flawed.
13.3 Change-Induced Emergency
E.g. a configuration change to the company-wide anti-abuse infrastructure.
- Details: change triggered a crash-loop in almost all externally facing systems and internal infrastructure started to fail.
- Response: the on-call SREs moved to dedicated secure rooms (panic rooms) with backup access to the production; the developer teams rolled back the change in five minutes; systems started to recover;
- Findings, what went well: immediate monitoring alerts (even though too noisy); incident communication worked well; out-of-band communication systems worked well; backup rollout/rollback CLI tools worked well. Google infrastructure rate-limited the upgrades. Swift developer response (a bit of luck).
- Findings, what was learned: incomlete canary testing. Too much noisy communication everywhere was disrupting the real work. Infrastructure for debugging started to go into crash-loops too.
13.4 Process-Induced Emergency
13.5 Ask the Big, Even Improbable, Questions: What If…?
13.6 Encourage Proactive Testing
14 Managing Incidents
14.1 Unmanaged Incidents
- Poor communication.
- Lack of coordination (freelancing);
14.2 Elements of Incident Management Process
- recursive separation of responsibilities. Know your role, don't mess into somebody's area; this gives more autonomy in decision making. Ask for more staff if needed.
- Incident Command: holds the high-level state about the incident. Delegate all the work they can't do themselves.
- Operational Work: applying operational tools to the task at hand.
- Communication: the public face of the incident response task force. Duties: periodic updates; keeping the incident logs up to date;
- Planning: supports Ops by dealing with longer-term issues: filing bugs, ordering dinner, arraning handoffs, etc.
- A recognized command post: IRC communication.
- live incident state document: can be messy, but must be functional; concurrently accessible (Google Docs, but the Google Docs team uses Google Sites).
- clear, live handoff at the end of the day.
14.3 A Managed Incident
14.4 Clear Conditions for Declaring an Incident
e.g.
- do you need to involve a second team to fix the problem?
- is the outage visible to customers?
- is the issue unsolved even after an hour's concentrated analysis?
14.5 Best Practices:
- prioritize: stop the bleeding, restore service, and preserve the evidence or root-causing;
- prepare: developer and document your incident management procedures in advance;
- trust: give full autonomy within the assigned role;
- introspect: pay attention to your emotional state while responding. If you start to panic, solicit more support;
- consider alternatives: periodically consideer your options and re-evaluate if one should continue the current action;
- practice: use the process routinely;
- change it around: take on a different role the next time;
15 Postmortem Culture: Learning from Failure
The cost of failure is education
Left unchecked, incidents may recur, multiply or cascade.
15.1 Google's Postmortem Philosophy
Every incident must be root-caused and documented. Blameless culture. Keep it constructive. Give confidence to escalate issues without fear.
15.2 Collaborate and Share Knowledge
Real-Time Collaboration. An open commenting/annotation system. Email notifications.
No postmortem left unreviewed.
15.3 Introducing a Postmortem Culture
requires continuous cultivation and reinforcement.
- Postmortem of the month;
- Google+ postmortem group;
- postmortem reading clubs;
- Wheel of Misfortune;
Visibly reward people for doing the right thing. Ask for feedback on postmortem effectiveness.
16 Tracking Outages
Outalator, an outage tracker.
16.1 Escalator
checks if the alert is acknowledged in the given interval. Otherwise passes the alert to the secondary on-call.
16.2 Outalator
View of a time-interleaved list of notifications for multiple queues at once;
- Aggregation: Combinating alerts into incident groups;
- Tagging: e.g. false-positive alerts. e.g.
cause:network,cause:network:switch,bug:76543, etc. - Analysis: what components are causing most outages, etc.
- Reporting and communication
- Unexpected benefits : …
17 Testing for Reliability
If you haven't tried it, assume it's broken
SRE adapt classical software testing methodologies to systems at scale. Testing is the mechanism you use to demonstrate specific areas of equivalence when changes occur.
Passing a test or a series of tests does not necessarily prove reliability. However, tests that are failing generally prove the absence of reliability. The Mean Time to Repair (MTTR) measures how long it takes the operations team to fix the bug. Testing systems allow zero MTTR (regarding production time). The Mean Time between Failures (MTBF). Coverage is needed.
17.1 Types of Software Testing
Traditional (offline) and production (online).
- Traditional tests: unit tests \(\Rightarrow\) integration tests \(\Rightarrow\) system tests ("\(\Rightarrow\)" stands for "underlies");
- Unit tests: TDD;
- Integration tests on assembled components; usage of dependency injection (e.g. Dagger).
- System tests on the end-to-end functionality of the system:
- smoke tests on very simple but critical behavior;
- performance tests;
- regression tests – may be quite expensive and run separately;
- Production tests interact with a live production system, unlike the traditional tests in a hermetic testing environment; Gradual rollout.
- Configuration tests
- Stress tests: graceful degradation or sudden failure?
- Canary tests: a subset of servers is upgraded and left in an incubation period.
17.2 Creating a Test and Build Environment
in a new project.
Prioritize the codebase parts: mission-critical, business-critical. Document all reported bugs as test cases. Set up a testing infrastructure. Continuous build system. Fix early.
17.3 Testing at Scale
17.4 Testing Disaster
- compute a checkpoint state that is eqiuvalent to cleanly stopping the service;
- push the checkpoint state to be loadable by existing nondisaster validation tools;
- support the usual release barrier tools;
Distributed repair challenges:
- operate outside of the mainstream API
- if normal behavior (e.g. eventually consistent) badly interacts with a repair procedure;
Statistical tests. Fuzzing (Lemon). Jepsen, Chaos Monkey.
17.5 The Need for Speed
Serve test results before context switch of an engineer.
17.6 Pushing to Production
17.7 Expect Testing Fail
Configuration changes should be treated as binary upgrades; configuration test coverage;
17.8 Integration
Integration testing configuration files:
- Interpreted configuration files: fragile, powerful;
- YAML: schema breakage issues;
- protobufs: predefined schema;
Defense in depth from bugs that made through testing.
17.9 Production probes
- known bad request;
- known good requests that can be repayed against production;
- known good requests that can't be replayed against production;
Fake backend versions.
17.10 Conclusion
18 Software Engineering in SRE
Google production environment is, by some measures, one of the most complex production environments ever built. A product-based mindset for internal SRE tools.
18.1 Why is it important?
18.2 Case Study: Auxon, capacity planning tool
18.3 Intent-based capacity planning
18.4 Precursors to Intent
Dependencies Performance Metrics Prioritization
18.5 Requirements and Implementation: Lessons Learned
Approximation. Launch and iterate. Modular design. Fuzzinness of requirements as a sign of modularity need.
Raising Awareness and Driving Adoption. Promote the software: a consistent and coherent approach, user advocacy, sponsorship of senior engineers and management; Documenatation.
18.6 Set (balanced) expectations
Don't promise too much or too early: deliver a Minimum Viable Product (MVP). Don't underplay the promises: the plan must inspire and provide clear benefits.
18.7 Identify Appropriate Customers
18.8 Customer Service
18.9 Design at the right level
18.10 Team Dynamics
partner with in-house experts
18.11 Getting There
A social effort as much as technical one.
- create and communicate a clear message: strategy, plans, benefits.
- evaluate the organization's capabilities:
- launch and iterate: the first round of development should aim for relatively straightforward and achievable goals.
- don't lower your standards: let your product be so good that you'd like to onboard if you were an outsider.
19 Load Balancing at the Frontend
Scale; no single point of failure. High-level load balancing.
19.1 Power Isn't the Answer
Imagine a completely reliable powerful machine. Physical limitations: speed of light,
Traffic load balancing: deciding what machine will handle a particular user request. Ideally, traffic is distributed in "optimal" fashion. What does this mean? There's no single answer:
- the hierarchical level at which we evaluate the problem (local vs global);
- the technical level (hardware vs software);
- the nature of the traffic we're dealing with;
E.g. two request scenarios: a basic search request and a video upload request. The most important variable for the search request is latency, whereas the most important variable for a video upload is success for the first time. therefore,
- the search request is sent to the nearest available datacenter;
- the video upload stream is routed into a link that is being underutilized – to maximize the throughput;
On the local level, all machines in a given datacenter are considered equally accessible.
Load balancing for large system is complicated and dynamic.
19.2 Load balancing using DNS
The simplest solution: return multiple A or AAAA records and let the client choose. No control over user behavior, no possibility to choose the closest frontend.
DNS middleman: nondeterministic reply path, additional caching implications;
Analyze traffic changes and continuously update the list of known DNS resolvers to track its potential impact; estimate the geographical distribution of the users behind each tracked resolver to direct users; Datacenter state and utilization to plan DNS routing.
Load balancing with DNS on its own is not sufficient.
19.3 Load balancing at the Virtual IP Address
VIP (Virtual IP Address) usually are shared across many devices. Implemented by network load balancers.
Consistent hashing to map packets to the connection paths. It deals with backend failures. NAT or modification of L2 packets: direct server response (DSR).
20 Load Balancing in the Datacenter
A stream of queries reaches a datacenter. The datacenter can handle the traffic.
A client task holds the connection to its client and to backend tasks. It should choose its backend tasks.
20.1 The Ideal Case
The load for a given service is spread perfectly over all its backend tasks and at any point in time, the least and most loaded backend tasks consume exactly the same amount of CPU. The ideal case: almost all machines in a datacenter are almost fully utilised.
Poor in-cluster load balancing may artificially limit resource availability: e.g. reserving 1000 CPUs actually gives 700 CPUs.
20.2 Identifying bad tasks: Flow Control and Lame Ducks
A simple approach: flow control, limit maximum number of connections to backends servers (if it is exceeded, that means that the services are unhealthy). It protects backends only from an exteme form of overload, not from long-lived connections.
Lame duck state: a backend may be in the following three states:
- healthy;
- refusing connections: completely unresponsive;
- lame duck: explicitly asking clients to stop sending requests (e.g. via RPC).
It allows clean shutdown.
20.3 Limiting the Connections Pool with Subsetting
Very high amount of backend connections waste CPU and memory resources. …
20.4 Load Balancing Policies
Simple round robin: the most common approach, widely used. But its results may be very poor: clients may not issue requests at the same rate; especially likely when vastly different services share the same backends;
- small subsetting:
Challenges of round robin balancing:
- varying query costs: the most expensive requests consume 1000x (or more) CPU than the cheapest ones. Semantic "fracturing" of requests.
- machine diversity: GCE/s (/Google Compute Units).
- unpredictable performance factors: antagonistic neighbors on a machine; task restarts;
Least-loaded round-robin: take one of the least loaded backends next. Pitfalls: if a task is seriously unhealthy, it might start serving 100% errors, because it "serves" the requests "very quickly" \(\Rightarrow\) sinkholing traffic. A solution: count its error responses as past tasks. Number of connections does not necessarily indicates true node load.
Weighted round robin: incorporate the backend load information into load balancing $⇒$$ a capability score for each backend. Worked very well in practice.
21 Handling Overload
is a goal of load balancing process. However, eventually some parts will gett overloaded, and this overload must be handled gracefully. A possible mitigation: serve degraded responses (from a local cache, search subsets, etc).
Extreme overload also should be handled well: redirects, handle resource errors.
21.1 The Pitfall of "Queries per Second"
Different queries can have vastly different resource requirements. The ratios may change. A better solution is to measure capacity directly in available resources. In a majority of cases (not all, for sure), simply using CPU consumption works well:
- GC turns memory pressure into CPU consumption;
- on other platforms it's possible to provision resources in such a way that they're very unlikely to run out before CPU runs out.
21.2 Per-customer Limits
What to do in the case of global overload.
21.3 Client-side throttling
Sometimes server-side rejection of requests is less effective than handling them.
Client-side throttling: adaptive throttling. I.e. each client keeps the following statistics for the last 2 minutes: \(requests\) and \(accepts\). Once the cutoff (\(requests/accepts > K\)) is reached, requests are rejected locally with a probability depending on the ratio.
Some latency of state is introduces: the higher K (more aggressive rejection), the more inertial it is.
21.4 Criticality
Stages: CRITICAL_PLUS, CRITICAL, SHEDDABLE_PLUS, SHEDDABLE.
Reject only requests of a given/less criticality. Propagate criticality automatically.
21.5 Utilisation Signals
executor load average (ELA)
21.6 Handling overload errors
"A large subset of backend tasks in the datacenter are overloaded"
- if the cross-datacenter balancing is working perfectly, this will not occur;
Requests should not be retried, errors should propagate up to the client. It is not practical to track and treat retries separately.
"A small subset of backend tasks in the datacenter are overloaded"
- typically caused by imperfections in load balancing.
21.7 Deciding to Retry
per-request retry budget (usually 3 attempts) per-client retry budget: ratio of retries to requests (usually less than 10%). Only direct neighbors should be allowed to retry; otherwise propagate "overload; don't retry".
21.8 Load from Connections
CPU and memory costs of maintaining/establishing a large pool of connections. Health checks (e.g. in RPC): a good thing, but may be too expensive for long-lived connections. A solution: creating/destroying connections dynamically in such case. batch proxies: batch client -> batch proxy -> backend. Adds flexibility to load.
21.9 Conclusions
- Good load-balancing techniques.
- Protection of individual tasks against overload.
- Take degradation conditions seriously.
- Do not left failures unchecked, they cascade.
- Do not shut down completely on overload. The goal is still to serve the amount of traffic that can be served.
22 Addressing Cascading Failure
If at first you don't succeed, back off exponentially
Why do people always forget that you need to add a little jitter?
A cascading failure (a domino effect) is a failure that grows over time as a result of positive feedback. Some parts of a system may fail and fail others.
22.1 Causes of Cascading Failures and Desiging to Address Them
Server overload.
Resource exhaustion: higher latency, elevated error rates, lower-quality results.
- CPU: effects are:
- increased number of in-flight requests;
- excessively long queue lengths;
- thread starvation
- CPU starvation,
- missed RPC deadlines,
- reduced CPU caching benefits.
- Memory: effects are:
- dying tasks;
- increased rate of GC -> increased CPU;
- reduction in cache hit rates;
- Threads;
- File descriptors;
22.2 Dependencies among resources
22.3 Service Unavailability
A server crash/lame duck state may increase load for other servers, crash-looping.
22.4 Preventing Server Overload
- load test the server capacity limits, test the failure mode for overload;
- serve degraded results;
- instrument server to reject requests when overloaded;
- instrument higher-level systems to reject requests: at reverse-proxies, at the load-balancers, at individual tasks;
- perform capacity planning;
22.5 Queue Management
Full queue: reject new requests. Queued requests consume memory and increase latency. The "burstier" traffic, the longer queues.
22.6 Load Shedding and Graceful Degradation
- Load shedding drops some proportion of load by dropping traffic as the server approaches overload conditions.
- per-task throttling.
- changing the queuing method from FIFO to LIFO or using the controlled delay (CoDel) may reduce load by removing requests that are unlikely to be worth processing. Or be more selective about what to drop.
- graceful degradation (should not trigger very often!).
22.7 Retries
22.8 Latency and Deadline
- picking deadline;
- missing deadlibes;
- deadline propagation;
22.9 Bimodal latency
Some of requests fail \(\Rightarrow\) hit deadline. E.g. 5% fail \(\Rightarrow\) retries until deadline \(\Rightarrow\) taking their threads \(\Rightarrow\) they may exhaust threads up to 80% \(\Rightarrow\) 80% of requests now fail locally due to the thread exhaustion.
Detecting may be very hard: mean latency does not show any signs, look at the distribution. Requests that don't complete should return. Deadline should not be magnitides longer than the mean request latency (usually bad). Limiting in-flight resources, abuse tracking for limited resources.
22.10 Slow startup and cold caching
Slow operation at startup:
- required service initialization;
- JVM warm-up;
- caches aren't filled yet;
Cold cache:
- A newly added cluster;
- Returning a cluster to service after maintanence;
- Restarts;
Solutions:
- overprovision for the start time;
- employ general cascading failure prevention techniques;
- slowly increase the load;
22.11 Always Go Downward in the Stack
Usually it's better to avoid intra-layer communication – e.g. possible cycles in the communication path.
22.12 Triggering Conditions for Cascading Failure
- process death: some server may die, reducing the amount of available capacity. E.g. cluster issues, assertion failures, a Query of Death, etc;
- process updates: plan infrastructure to be sufficient for live upgrade, push off-peak;
- new rollouts: check for recent changes;
- organic growth;
- planned changes, drains, turndowns;
- request profile changes;
- resource limits: possible resource overcommitment;
22.13 Testing for Cascading Failures
- test until failure and beyond: at some point, requests should degrade or error should be served; the response rate should not decrease;
- if a component enters a degraded mode on heavy load, is it capable of exiting the degraded mode wihtout human intervention?
- if a couple of servers crash, how much does the load need to drop in order for the system to stabilize;
- often some subtle concurrency bugs trigger at the load fringe;
- load test each component separately;
- test popular clients: understand how large clients use your service.
- test noncritical backends; their absence/connection blackholing should not take the entire system down;
22.14 Immediate Steps to Address Cascading Failure
- increase resources if you have spare resources available;
- stop health check failures/deaths; sometimes health checking makes a system unhealthy (lame duck mode, etc). Process health checking ("is process alive?") and service health checking ("is the service operating correctly?") are two different things.
- restart servers may help; why: e.g. GC death spiral, in-flight requests have no deadlines, the servers are deadlocked, etc; make sure to identify the source of the cascading failure before restarting;
- drop traffic; a lot of user-visible harm; try to drop less important traffic;
- enter degraded modes: must be built in the services;
- eliminate batch load;
- eliminate bad traffic, if some queries are creating heavy load or crashes;
22.15 Closing Remarks
Something needs to be done for an overloaded system. Be careful not to trade one outage for another.
23 Managing Critical State: Distributed Consensus for Reliability
Nodes fail. Network partitions are inevitable. Group of processes may want to reliably agree on:
- which process is the leader of the group;
- what is the set of processes in the group;
- has a message been successfully committed to a distributed queue;
- does a process hold a lease or not;
- what is a value in a datastore for a given key;
Use formally proven and thoroughly tested distributed consensus systems. Informal approach is bug-prone and fraught with outages and hard-to-fix data consistency problems.
CAP theorem. Take two of:
- consistent views of the data at each node;
- availability of the data at each mode;
- tolerance to network partitions.
The traditional ACID datastore semantics:
- atomicity;
- consistency;
- isolation;
- durability.
Distributed systems often provide with BASE: Basically Available, Soft state and Eventual consistency. Multimaster replication combined with some approach to resolve conflicts (often as simple as "the latest timestamp wins") \(\Rightarrow\) eventual consistency. May be surprising in the event of clock drift. BASE datastores may be hard to develop with.
23.1 Motivating the Use of Consensus: Distributed Systems Coordination Failure
Network partitions may be due to:
- a very slow network;
- some, but not all, messages are dropped;
- throttle occuring in one direction, but not the other.
Case Study I: The Split-Brain Problem: Sets of pairs of servers: one leader + one follower; heartbeats between them. If a server can't contact its partner, it issues STONITH (Shoot the Node in the Head) and takes mastership over files. But: leader election is a reformulation of the distributed asynchronous consensus problem, which cannot be solved correctly by using heartbeats.
Case Study II: Failover Requires Human Intervention. A highly sharded database system has a primary for each shard, which replicates synchronously to a secondary in another datacenter; an external system checks the health of the primaries, and, if they are no longer healthy, promotes the secondary to primary. If the primary can't determine health of its secondary, it makes itself unavailable and escalates to a human. Does not risk data loss, but it negatively impactes availability of data.
Case Study III: Faulty Group-Membership Algorithms A system has a component that performs indexing and searching services. A gossip protocol to discover and join. The cluster elects a leader for coordination. In the case of a network partition each side (incorrectly) elects a master, leading to a split-brain scenario.
23.2 How Distributed Consensus Works
The consensus problem has multiple variants. We are interested in asynchronous distributed consensus (with potentially unbounded delays in message passing). Distributed consensus algorithms may be crash-fail (the crashed nodes never return to the system) or crash-recover. Algorithms may deal with Byzantine and non-Byzantine failures. The FLP impossibility result: no asynchronous distributed consensus algorithm can guarantee progress in the presence of an unreliable network.
In practice: approach the distributed consensus problem in bounded time by ensuring that the system has sufficient healthy replicas and network connectivity to make progress reliably most of the time. The system should have exponential backoffs with randomized delays. The protocols guarantee safety, and adequate redundancy in the system encourages liveness. The original solution to the distributed consensus problem was Lamport's Paxos protocol.
23.3 Paxos Overview: An Example Protocol
Operates in as a sequence of proposals, which may or may not be accepted. Each proposal has a sequence number. Strict sequencing of proposals. Persistent storage of commits. Proposals must be from disjoint sets for different nodes. It lets you to agree on a value and proposal number once.
23.4 System Architecture Patterns for Distributed Consensus
Higher level components built on the distributed consensus: queues, configuration stores, datastores, locking, leader elections, etc. Zookeeper, Consul, etcd.
23.5 Reliable Replicated State Machines
A replicated state machine is a system that executes the same set of operations, in the same order, on several processes. RSMs are the fundamental building blocks of useful distributed systems components and services. The operations on a RSM are ordered globally through a consensus algorithm. Any deterministic program can be implemented as a highly available replicated service by being implemented as an RSM.
23.6 Reliable Replicated Datastores and Configuration Stores
Reliable replicated datastores are an application of replicated state machines. Timestamps are highly problematic in distributed systems.
23.7 Highly Available Processing Using Leader Election
The single leader mechanism is a way of ensuring mutual exclusion at a coarse level.
23.8 Distributed Coordination and Locking Services
A barrier in a distributed computation is a primitive that block a group of processes from proceeding until some condition is met. E.g. all Map tasks before Reduce. A barrier may be a single machine, i.e. a single point of failure. A barrier may be an RSM. Locks can be implemented as an RSM too. It is essential to use renewable leases with timeouts instead of infinite locks.
23.9 Reliable Distributed Queuing and Messaging
Queuing-based systems can tolerate failure and loss of worker nodes relatively easily. However, the system must ensure that claimed tasks are successfully processed. A lease system is recommended. The downside of queuing-based systems is that loss of the queue process prevents the entire system from operating. Implementing the queue as an RSM can minimize the risk and make the entire system far more robust. Atomic broadcast is a distributed systems primitive in which messages are received reliably and in the same order by all participants. Publish-subscribe messaging infrastructures (not all of them provide atomic guarantees). The queuing as work distribution pattern uses queues as a load balancing device. Publish-subscribe systems can also be used to implement coherent distributed caches.
Queuing and messaging systems often need excellent throughput, but don't need extremely low-latency (seldom being directly used-facing).
23.10 Distributed Consensus Performance
Conventional wisdom has generally held that consensus algorithms are too slow and costly to use for many systems that require high throughput and low latency. This is simply not true: implementation may be slow. There is no one "best" distributed consensus and state machine replication algorithm for performance.
Workloads can very in many ways and understanding how they can vary is critical to discussing performance:
- throughput;
- the type of requests: proportion of operations that change state;
- the consistency semantics required for read operations;
- request sizes, if size of data payload can vary.
Deployment strategies vary too:
- is the deployment local or wide area?
- what kinds of quorum are used, where are the majority of processes?
- does the system use sharding, pipelining, batching?
23.11 Multi-Paxos: Detailed Message Flow
It uses a strong leader process: unless a leader has not yet been elected or some failure occurs, it requires only one round trip from the proposer to a quorum of acceptors to reach consensus. Dueling proposers: an indefinite livelock. Solution: either by electing a proposer process, or by using a rotating proposer.
23.12 Scaling Read-Heavy Workloads
Replicated datastores have an advantage: trading strong consistency for scaling. To ensure consistency before read, do one of:
- a read-only consensus operation;
- read the data from a replica that is guaranteed to be the most up-to-date.
- use quorum leases: trade write performance for consistent read performance;
23.13 Quorum Leases
Quorum leases are a recently developed distributed consensus performance optimization aimed at reducing latency and increasing throughput for read operations. All operation that changes the state of that data must be acknowledged by all replicas in the read quorum. If any of these replicas becomes unavailable, the data cannot be modified until the lease expires.
23.14 Distributed Consensus Performance and Network Latency
Two major physical constraints:
- the network round-trip time;
- the time to write data to a persistent storage.
"Distant" replicas are preferred for reliability => long RTTs. TCP handshake and slow start may be a bottleneck. A pool of regional proxies to keep persistent high-throughput connections.
23.15 Reasoning about Performance: Fast Paxos
Fast Paxos is a Paxos version designed to improve its performance over wide area networks.
23.16 Stable Leaders
- all operations that change state must be sent via the leader => network latency;
- the leader process's outgoing network bandwidth is a system bottleneck;
- single point of slowdown;
23.17 Batching
23.18 Disk Access
Batching
23.19 Deploying Distributed Consensus-Based Systems
Number of Replicas. Majority-based quorums: a group of 2f+1 replicas may tolerate f failures. For Byzantine fault tolerance, it's 3f+1 replicas that may tolerate f failures. One of machines may be on maintanence => three replicas to support non-Byzantine failures with maintenance. If an unplanned failure occurs during a maintenance window, then the consensus system become unavailable, which is unacceptable, => five replicas should run, allowing up to two failures. No intervention on one failure, but if three are left, an additional replica or two should be added.
If a consensus system loses too many replicas to form a quorum, then the system is in theoretically unrecoverable state. Other replicas may be added and catching up, but there is a possibility of data loss.
The replicated log is a very important in practice. Raft describes a method for ensuring consistency in replicated logs. If a five-instance Raft system looses all of its members except the leader, the leader is still guaranteed to have the full knowledge. If the leader is lost, no guarantees can be made.
The number of replicas is a trade-off between:
- the need for reliability;
- frequency of planned maintenance;
- risk;
- performance;
- cost.
23.20 Location of Replicas
A trade-off between the failure domains that the system should handle and the latency requirements.
A failure domain is the set of components that can become unavailable as a result of a single failure. E.g.:
- a physical machine;
- a rack in a datacenter served by a single power supply;
- several racks in a datacenter that are served by one piece of networking equipment;
- a datacenter that could be rendered unavailable by a fiber optic cable out;
- a set of datacenters in a single geographic area that could be all affected by a single natural disaster such as a hurricane.
Regular backups for critical data even if the system is consistent and distributed.
23.21 Capacity and Load Balancing
When designing a deployment, you must make sure that there is sufficient capacity to deal with load. In the case of sharded deployments, you can adjust capacity adjusting the number of shards. For consensus groups, adding replicas.
Adding more replicas has a cost: for a strong leader algorithms, it imposes more load on the leader process; for a p2p system, it imposes more load on all processes. For read-heavy workloads, adding more replicas may be the best approach. Adding a replica in a majority quorum can potentially decrease system availability somewhat. Adding two and more replicas in the same failure domain may be redundant.
23.22 Quorum composition
Spread the replicas as evenly as possible, with similar RTTs between all replicas.
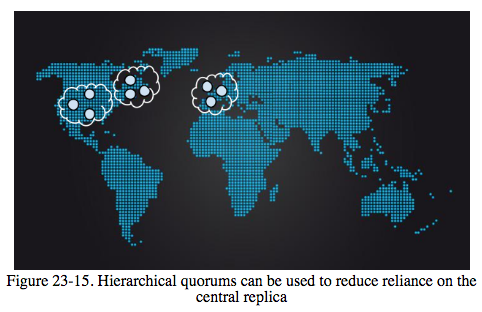
Hierarchical quorums can be used to reduce reliance on the central replica.
23.23 Monitoring Distributed Consensus Systems
Special attention to:
- the number of members running in each consensus group;
- the status of each process (healthy or not healthy);
A process may be running but unable to make progress for some reason. Monitor:
- persistently lagging replicas;
- whether leader exists;
- number of leader changes;
- consensus transaction number;
- number of proposals seen and agreed upon;
- throughput and latency;
To understand the system performance:
- latency distributions for proposal acceptance;
- distributions of network latencies observed between parts of the system in different locations;
- the amount of time acceptors spend on durable logging;
- overall bytes accepted per second in the system.
23.24 Conclusion
Whenever you see leader election, critical shared state, or distributed locking, think about distributed consensus; any lesser approach is a ticking bomb waiting to explode in your systems.
24 Distributed Periodic Scheduling with Cron
Cron is designed so that the system administrators and common users of the system can specify commands to run and when these commands run. It executes various types of jobs, including GC and periodic data analysis. Usually implemented using a single component, crond.
24.1 Reliability Perspective
Cron's failure domain is essentially just one machine.
The only persistent state is crontab.
anacron is a notable exception: it attempts to launch jobs that would have been launched when the system was down.
24.2 Cron jobs and Idempotency
An Idempotent task is safe to launch multiple times. Some tasks are idempotent, some are not. Prefer to avoid running task again if unsure. Failure to launch is acceptable for some tasks and unacceptable for others. Every cronjob owner should monitor it.
24.3 Cron at Large Scale
Decoupling processes from machines. Specify a datacenters you want to run your job in. Local state: better use GFS/Colossus.
24.4 Extended Requirements
24.5 Building Cron at Google
Tracking the state of Cron jobs. External distributed storage or internal state of the Cron service itself. Multiple replicas of the Cron service and consensus through Paxos. The leader replica is the only that actively launche cron jobs. An internal scheduler. The follower keep track of the state of the world, as provided by the leader in order to take over at a moment's notice if needed. All state changes are communicated via Paxos. All cron job schedules within the system must be consistent. If a leader replica dies or otherwise malfunctions, a follower should be elected as a new leader. The election must converge faster than one minute. Resolving partial failures.
24.6 Storing the State
Local filesystem. Paxos as a synchronous log of updates.
24.7 Running Large Cron
The thundering herd: Large Cron batches may spike datacenter usage. Solution: random values.
25 Data Processing Pipelines
25.1 Origin of the Pipeline Design Pattern
Coroutines, the DTSS communication files, the UNIX pipes, ETL pipes.
25.2 Initial Effect of Big Data on the Simple Pipeline Pattern
Depth of a pipeline
25.3 Challenges with the Periodic Pipeline Pattern
Periodic pipelines are generally stable when there are sufficient workers for the volume of data and execution demand is within computational capacity. Instabilities such as processing bottlenecks are avoided when the number of chained jobs and the relative throughput between the jobs remains uniform. Periodic pipelines are useful and practical. MapReduce and Flume. The periodic pipeline model is fragile. Organic growth and change inevitably begin to stress the system.
25.4 Troubles Caused by Uneven Work Distribution
Some indivisible chunks are too large for one node: a hanging chunk.
25.5 Drawbacks of Periodic Pipelines in Distributed Environments
Periodic pipelines typically run as lower-priority batch jobs. Google's cluster management solution includes an alternatives mechanism for such pipelines. Running a well-tuned periodic pipeline successfully is a deliate balance between high resource cost and risk of preemptions. Delays of up to a few hours might well be acceptable for pipelines that run daily.
25.6 Monitoring Problems in Periodic Pipelines
Real-time information on runtime performance metrics.
25.7 "Thundering Herd" Problems
Given a large enough periodic pipeline, potentially thousands of workers immediately start work. If retry logic is not implemented, correctness problems can result when work is dropped upon failure. If retry logic is poor, it can compound the problem.
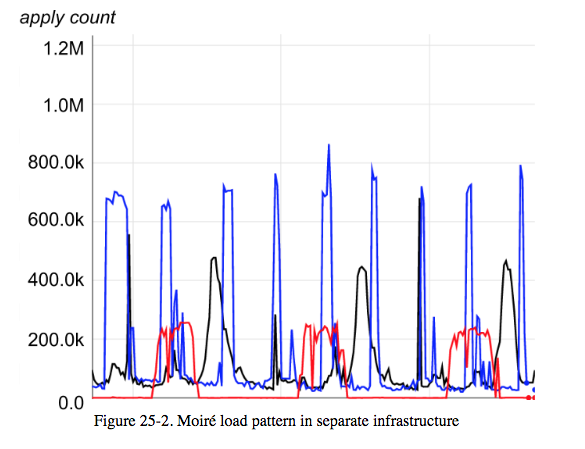
25.8 Moiré Load Pattern
When two or more pipelines run simultaneously and their execution sequences sometimes overlap.
25.9 Introduction to Google Workflow
Workflow as Model-View-Controller pattern:
Task Master is the model. Workers are the views. A controller may be added to support a number of auxiliary system actiivites that affect the pipeline, such as scaling of the pipeline, snapshotting, workcycle state control, rolling back pipeline state, etc.
Task Master -> Workers: work units; Workers -> Task Master : completed work units; Controller -> Task Master: Workcycle, Scaling, Snapshotting, etc.
25.10 Stage of Execution in Workflow
We can subdivide a pipeline into task groups with their own task managers.
25.11 Workflow Correctness Guarantees
Each output file has a different name, to prevent orphaned workers from interfering.
Versioning of all tasks.
Workflow embeds a server token, a unique ID for this particular Task Master.
Workflow correctness guarantees are:
- worker output through configuration tasks creates barriers on which to predicate work;
- all work committed requires a currently valid lease head by the worker;
- output files are uniquely named by the workers;
- the client and the server validate the Task Manager itself by checking a server token on every operation.
At this point, it may be easier to use Spanner or another database.
25.12 Ensuring Business Continuity
Big Data pipelines need to continue processing despite failures of all types, including fiber cuts, weather events, cascading power grid failures.
To obtain global consistency, the Task Manager stores journals on Spanner, using it as a globally available and consistent (but low-throughput) filesystem. Stages of a pipeline.
26 Data Integrity: What You Read is What You Wrote
When users come first, data integrity is whatever users think it is.
An incomplete definiton: Data integrity is a measure of the accessibility and accuracy of the datastores needed to provide users with an adequate level of service.
How long is "too long" for data to be unavailable? 24 hours as a good starting point.
Data loss, data corruption, and extended unavailability are typically indistinguishable to users. User access to data is especially important.
26.1 Data Integrity's Strict Requirement
SLO of 99.99% good bytes in 2 GiB artifact is a catastrophic corruption in the majority of cases.
Proactive detection of data loss/corruption and rapid repair and recovery.
26.2 Choosing a Strategy for Superior Data Integrity
An application may be optimized for some combination of:
- Uptime (availability), the proportion of time a service is usable by its users.
- Latency: how responsive a service appears to its users.
- Scale: a service volume of users and the mixture of workloads the service can handle before latency suffers.
- Velocity: how fast a service can innovate (at a reasonable cost).
- Privacy involves complex requirements.
Many cloud applications evolve atop of a mixture of ACID and BASE. BASE allows for higher availability than ACID, in exchange for a softer distributed consistency guarantee.
When velocity is prevalent, any well-known for developers APIs will do, e.g. Blobstore. A system of out-of-bound checks and balances to prevent degradation.
26.3 Backups Versus Archives
No one really wants backups, people really want restores. A backup must be usable for an effective disaster recovery.
Archives safekeep data for long periods of time to meet auditing, discovery and compliance needs.
26.4 Requirements of the Cloud Environment in Perspective
Techical challenges of the cloud:
- recovered data may be not correct in case of nontransactional backups;
- different generations of business logic may evolve in parallel, if a service does not allow much downtime;
- if interacting services are versioned independently, they can interact in unexpected ways, leading to accidental data corruption or loss;
APIs must be simple, easy to use; at the same time they must convey:
- data locality and caching;
- local and global data distribution;
- strong and/or eventual consistency;
- data durability, backups, recovery;
26.5 Google SRE Objectives in Maintaining Data Integrity and Availability
- Data integrity is the means; data availability is the goal.
- Delivering a recovery system, rather than a backup system;
- Types of failures that lead to data loss; classified as:
- root cause: user action, operator error, application bug, infrastructure defect, hardware fault, site disaster;
- scope: wide, narrow/directed;
- rate: big bang, slow and steady;
26.6 Challenges of Maintaining Data Integrity Deep and Wide
Replication and redundancy are not recoverability.
Retention: how long do you keep data.
26.7 How Google SRE Faces the Chanllenges of Data Integrity
Defense in depth: 24 possible combinations of failure modes. Multiple layers of protection.
- The first layer, soft (lazy) deletion: protects against mistakes by users;
- The second line of defense: backups and their related recovery methods; protects against bugs in applications and mistakes by application service providers;
- The third layer is regular data validation.
26.7.1 First Layer: Soft Deletion
A trash bin: purge data after some delay (e.g. 15, 30, 45, 60 days) if possible (non-confidential data).
Hide purge functionality of APIs, do not make it easy to use and abuse for developers.
26.7.2 Second Layer: Backups and Recovery
- which backup and recovery methods to use;
- how frequently you establish restore points; incremental/full backups;
- where do you store backups;
- how long do you retain backups;
Replication. Methods for 1 TB scale do not scale to methods for exabyte scale. Securing and validating 700 PB may be challenging. Trust points in data.
26.7.3 Third Layer: Early Detection
"Bad" data propagates.
Out-of-band data validation. Most often, a batch of Hadoop jobs. Can be expensive.
Knowing that data recovery will work. Recovery process may be broken itself. Continuously test it. Set up alerts for failure of a recovery process.
26.8 Case studies
Gmail, February 2011: restore from GTape.
- an estimate of restore time was delivered; this situation had been simulated before.
- all accounts were restored in several hours;
- >99% recovered in the estimated time;
Google Music, March 2012: runaway deletion detection. 1.5 PB tape recovery from offline storage locations. 5337 backup tapes, 17 tapes were bad.
26.9 Google Principles of SRE as Applied to Data Integrity
- beginner's mind: never think that you understand enough of a complex system to say that it won't fail;
- trust but verify;
- hope is not a strategy: system components that are not continuously tested fail when you need them most. Regular exercise of data recovery.
- defense in depth;
- revisit and reexamine: systems change.
26.10 Conclusions
Recognizing that not just anything may go wrong, but everything will go wrong, is a significant steps towards preparation for any real emergency.